How to Read/Interpret htop
Understanding the htop Interface
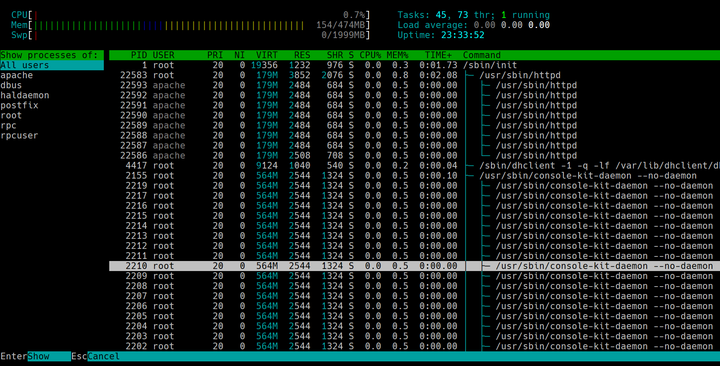
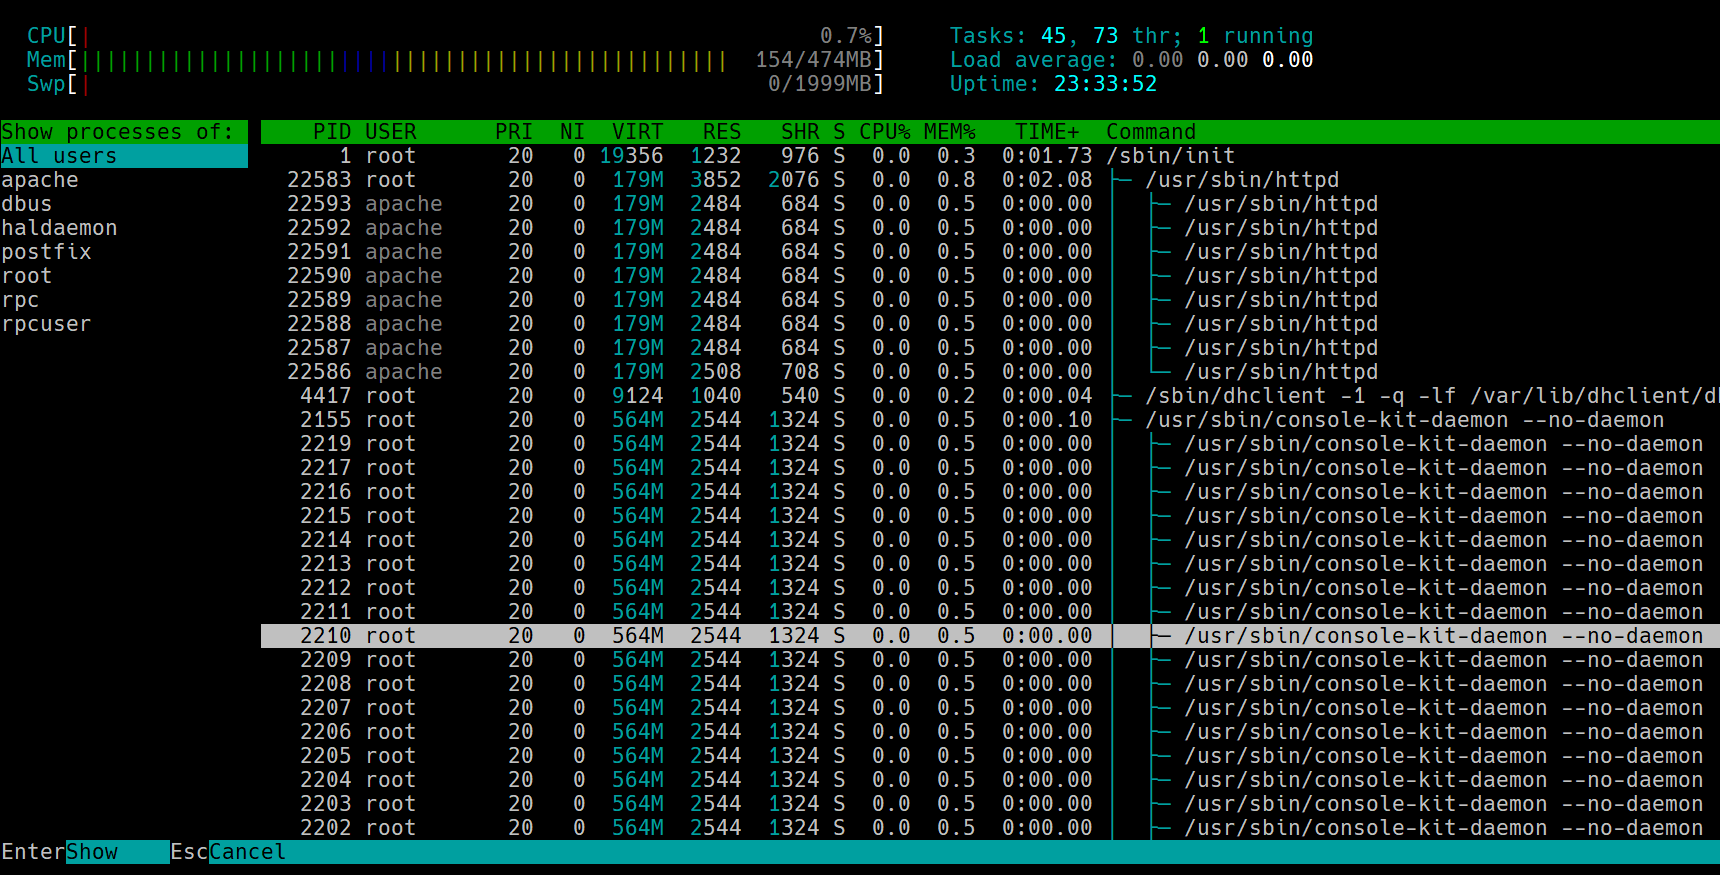
When you launch htop, you’ll see a colorful, interactive display divided into several sections. Here’s how to read and interpret each part:
1. Header Section
The top of the htop interface provides an overview of system resource usage:
- CPU Usage Bars: Shows CPU utilization for each core. Colors indicate:
- Green: User processes
- Blue: System (kernel) processes
- Red: Low-priority (nice) processes
- Memory (RAM) and Swap Usage: Displays total, used, and available memory. Colors indicate:
- Green: Used memory
- Blue: Buffers
- Yellow: Cache
- Load Average: Represents the system load over 1, 5, and 15 minutes.
- Uptime: Shows how long the system has been running.
2. Process List
The main section lists all running processes. Each process is displayed with the following columns:
- PID: Process ID (unique identifier).
- USER: The user running the process.
- PRI: Process priority (lower values mean higher priority).
- NI: Nice value (adjusts process priority).
- VIRT: Total virtual memory used by the process.
- RES: Resident memory (physical RAM used).
- SHR: Shared memory (memory shared with other processes).
- S: Process status (e.g.,
Rfor running,Sfor sleeping,Zfor zombie). - CPU%: Percentage of CPU used by the process.
- MEM%: Percentage of RAM used by the process.
- TIME+: Total CPU time used by the process.
- Command: The command or program name.
3. Footer Section
The bottom of the interface displays a list of shortcuts for common actions:
- F1: Help (displays a list of all shortcuts).
- F2: Setup (customize the display).
- F3: Search for a process.
- F4: Filter processes by name.
- F5: Tree view (show processes hierarchically).
- F6: Sort processes (e.g., by CPU%, MEM%, or PID).
- F7/F8: Adjust process priority (nice value).
- F9: Kill a process.
- F10: Quit htop.
Key Features to Use in htop
- Tree View (F5): Visualize processes in a hierarchical structure, useful for understanding parent-child relationships.
- Sorting (F6): Sort processes by CPU%, MEM%, or other columns to identify resource-heavy tasks.
- Kill Process (F9): Terminate unresponsive or unwanted processes directly from htop.
- Adjust Priority (F7/F8): Change the priority of a process to optimize system performance.
Why Programmers Should Use htop
- Real-Time Insights: htop provides a live view of system performance, making it ideal for debugging and optimization.
- User-Friendly Interface: Its color-coded, interactive display is easier to use than traditional tools like
top. - Customizable: Tailor the interface to show only the information you need.
Conclusion:
Reading htop is a skill every programmer should master. By understanding its interface and features, you can efficiently monitor system resources, troubleshoot performance issues, and optimize your workflow. Whether you’re debugging an application or managing a server, htop is an indispensable tool in your arsenal.