btop vs htop Which Should Choose
btop vs htop: Which System Monitoring Tool Should Programmers Choose?
When it comes to system monitoring tools, htop has long been a favorite among programmers and system administrators. However, btop has emerged as a modern alternative, offering a visually appealing interface and advanced features. In this blog, we’ll compare btop vs htop, highlighting their strengths, weaknesses, and use cases to help you decide which tool is best for your needs.
What is htop?
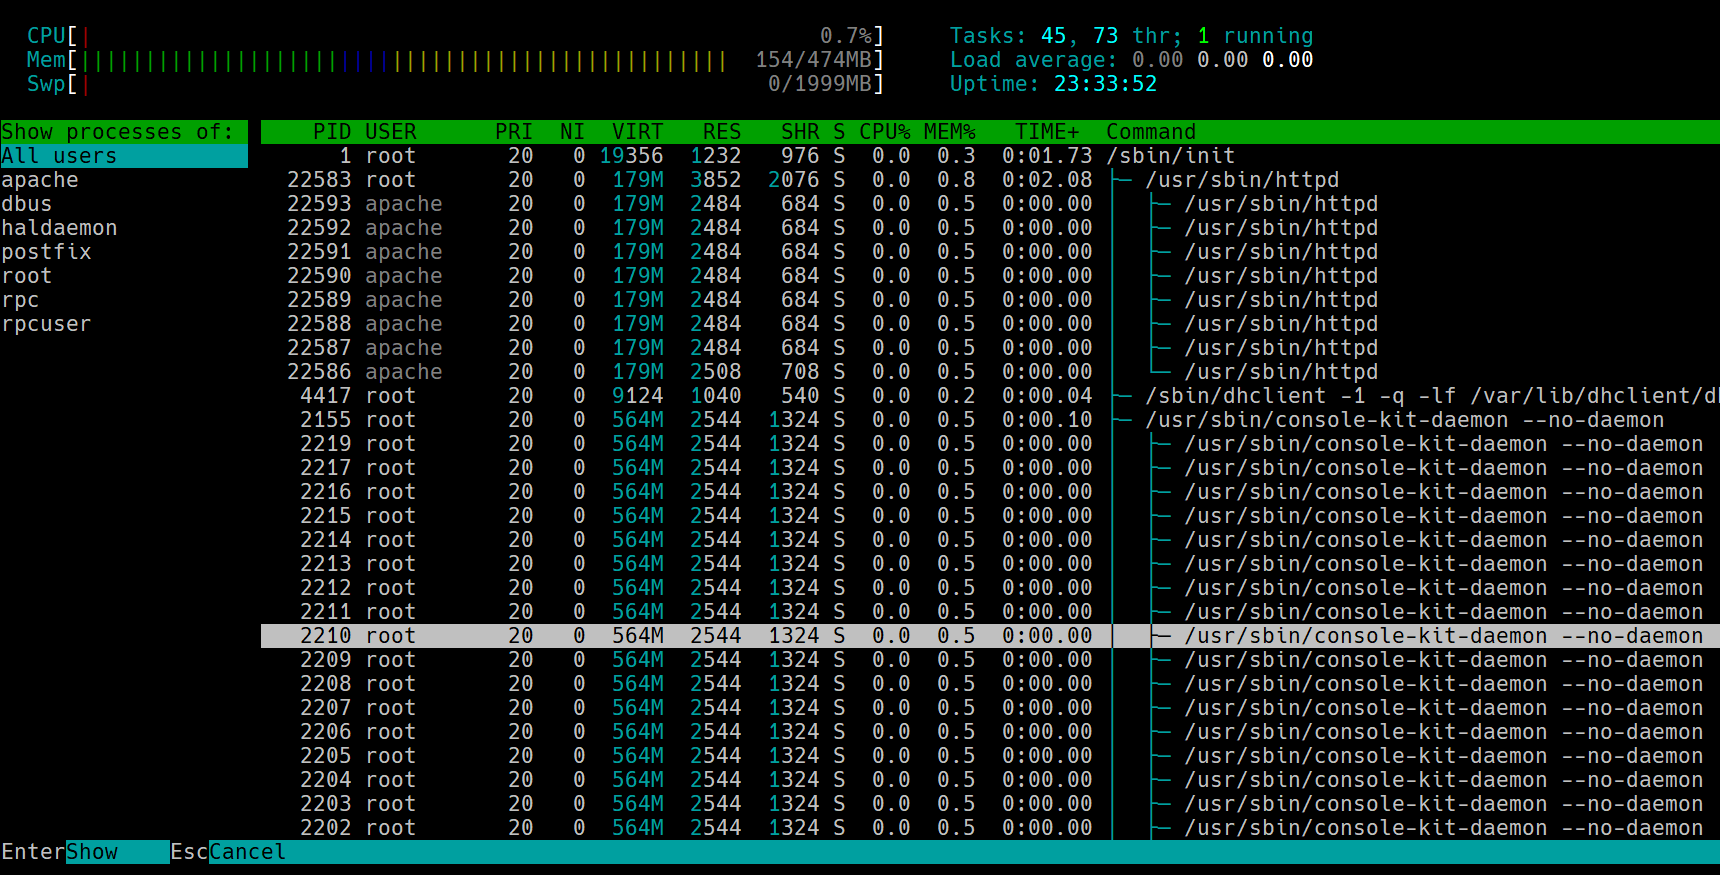
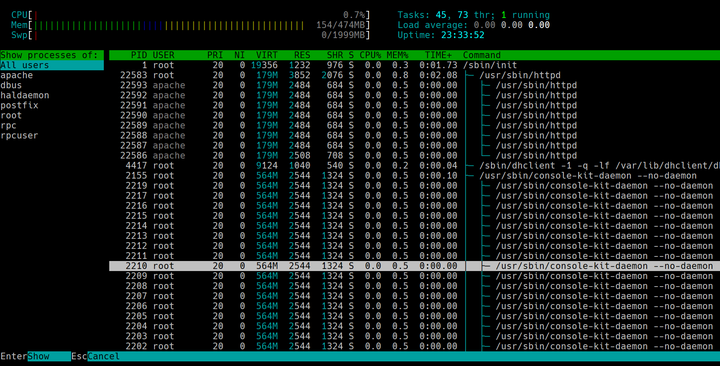
htop is an interactive process viewer for Unix-based systems. It provides real-time insights into CPU, memory, and process management, with a user-friendly interface that improves upon the traditional top command. Key features include:
- Color-coded process display.
- Mouse support for easy navigation.
- Customizable views and sorting options.
What is btop?
btop is a modern system monitoring tool designed to be a more visually engaging alternative to htop. It offers detailed metrics, including GPU and network usage, and supports advanced customization. Key features include:
- Real-time graphs for CPU, memory, and network.
- Customizable themes and layouts.
- Support for mouse interaction.
btop vs htop: Key Differences
1. User Interface
- htop: Simple and functional, with a focus on ease of use. It uses color coding to differentiate processes but lacks advanced graphical elements.
- btop: Visually rich, with real-time graphs and a modern design. It’s more appealing to users who prefer a polished interface.
2. Features
- htop: Focuses on core system metrics like CPU, memory, and processes. It’s lightweight and ideal for quick monitoring.
- btop: Offers additional features like GPU monitoring, network usage graphs, and detailed disk I/O statistics. It’s better suited for users who need in-depth insights.
3. Customization
- htop: Allows basic customization, such as adding or removing columns and sorting processes.
- btop: Provides extensive customization options, including themes, layouts, and the ability to display or hide specific metrics.
4. Performance
- htop: Lightweight and fast, making it ideal for older systems or quick checks.
- btop: More resource-intensive due to its graphical elements, but still performs well on modern hardware.
Use Cases: When to Choose htop or btop
Choose htop if:
- You need a lightweight, no-frills tool for quick system checks.
- You’re working on older hardware or systems with limited resources.
- You prefer a simple, text-based interface.
Choose btop if:
- You want a visually appealing tool with advanced metrics like GPU and network usage.
- You’re on modern hardware and can afford slightly higher resource usage.
- You value customization and a modern user experience.
Practical Example: Monitoring a Web Server
Imagine you’re managing a web server and need to monitor its performance:
- With htop: You quickly check CPU and memory usage to identify resource-hogging processes. Its simplicity allows you to focus on the task without distractions.
- With btop: You use its real-time graphs to monitor network traffic and disk I/O, helping you identify bottlenecks and optimize server performance.
Conclusion
Both htop and btop are powerful tools for system monitoring, but they cater to different needs. htop is ideal for quick, lightweight monitoring, while btop offers a modern, feature-rich experience for users who need detailed insights and a visually appealing interface. Choose the tool that best aligns with your workflow and system requirements.