htop vs top Which Should Choose
htop vs top: Which System Monitoring Tool Should Programmers Choose?
Introduction:
When it comes to monitoring system performance on Linux, two tools stand out: htop and top. Both are widely used by programmers and system administrators, but they cater to different needs. In this blog, we’ll compare htop vs top, highlighting their strengths, weaknesses, and practical use cases to help you decide which tool is best for your workflow.
What is top?
top is a classic command-line tool for real-time system monitoring. It provides a snapshot of running processes, CPU usage, memory consumption, and more. While it’s lightweight and available on almost all Unix-based systems, its interface is text-based and lacks interactivity.
What is htop?
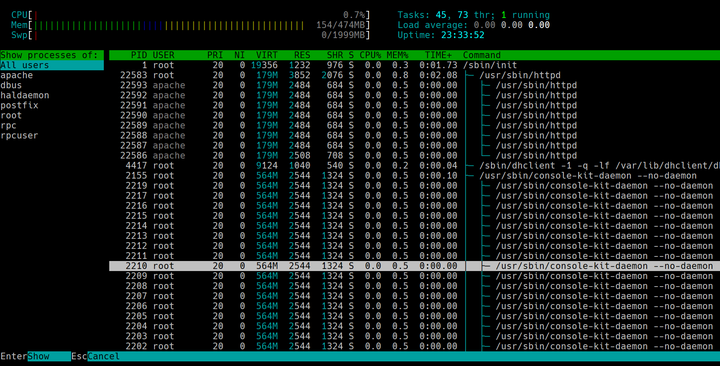
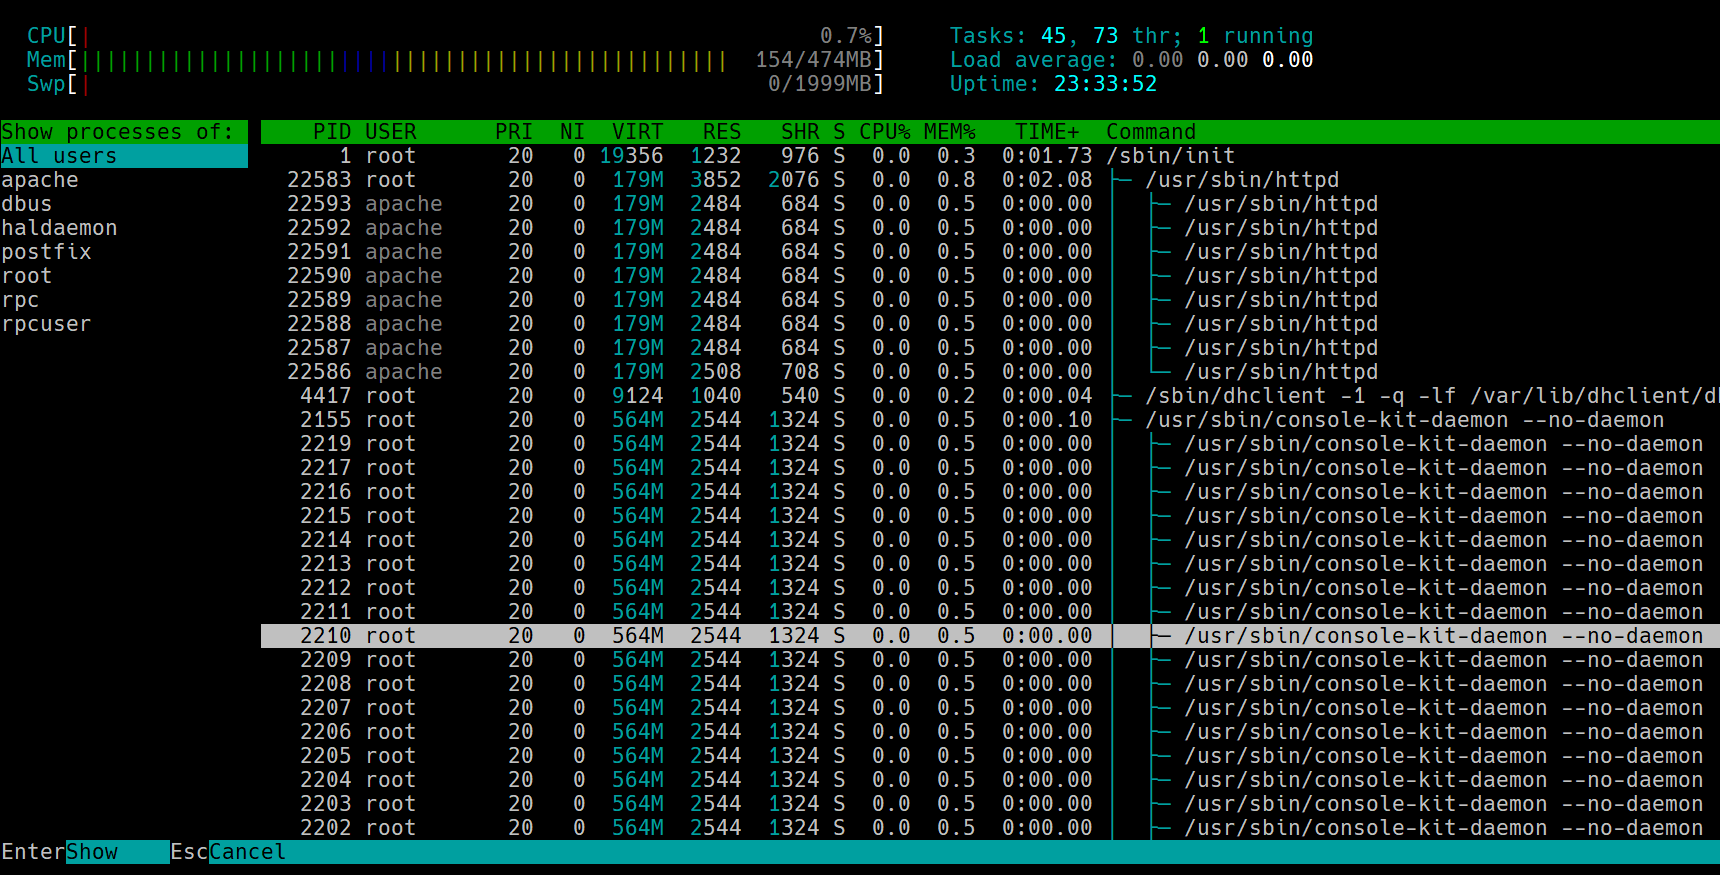
htop is an enhanced version of top, offering a more user-friendly and interactive experience. It features a color-coded interface, mouse support, and advanced functionalities like process filtering and tree views. It’s designed to make system monitoring more intuitive and efficient.
Key Differences Between htop and top
1. User Interface
- top: Text-based and static, with limited interactivity. It displays a fixed list of processes and requires manual input for actions like killing processes or changing priorities.
- htop: Color-coded and interactive, with support for vertical and horizontal scrolling. It allows users to navigate and manage processes using both keyboard shortcuts and mouse clicks.
2. Functionality
- top: Provides basic process monitoring, including CPU, memory, and load averages. It’s suitable for quick checks but lacks advanced features.
- htop: Offers additional features like process filtering, tree views, and the ability to kill or renice processes without typing PIDs. It also supports customizable displays and real-time graphs.
3. Ease of Use
- top: Requires memorizing commands for actions like killing processes (e.g.,
kfollowed by PID) or changing priorities (e.g.,rfollowed by PID and nice value). - htop: Simplifies these actions with intuitive shortcuts (e.g.,
F9to kill a process) and mouse support, making it more accessible for beginners.
4. Performance
- top: Lightweight and fast, making it ideal for older systems or environments with limited resources.
- htop: Slightly more resource-intensive due to its graphical elements, but still performs well on modern hardware.
Practical Use Cases
Case 1: Debugging a Memory Leak
- With top: You can identify high-memory processes by sorting the list by memory usage (
Shift + M). However, tracking specific processes over time can be challenging due to the lack of color coding or filtering. - With htop: You can use the color-coded interface to highlight memory-hogging processes and apply filters to focus on specific applications. The tree view (
F5) also helps you understand process hierarchies, making it easier to pinpoint memory leaks.
Case 2: Managing a Web Server
- With top: You can monitor CPU and memory usage to ensure the server is running smoothly. However, killing unresponsive processes requires typing the PID, which can be time-consuming.
- With htop: You can quickly kill processes using
F9and adjust priorities withF7/F8. The real-time graphs also help you visualize resource usage trends, making it easier to optimize server performance.
Which Tool Should You Choose?
- Choose top if:
- You need a lightweight tool for quick system checks.
- You’re working on older hardware or systems with limited resources.
- You prefer a simple, text-based interface.
- Choose htop if:
- You want a more interactive and visually appealing tool.
- You need advanced features like process filtering, tree views, or mouse support.
- You’re on modern hardware and can afford slightly higher resource usage.
Conclusion
Both htop and top are powerful tools for system monitoring, but they cater to different needs. top is ideal for quick, lightweight monitoring, while htop offers a more modern, feature-rich experience. By understanding their differences and use cases, you can choose the tool that best fits your workflow and system requirements.